

|
Mechanical Forensics Engineering Services, LLC
|

|
Skidding Friction:
A Review of Recent Research
|
INTRODUCTION
In order to conduct a crash analysis, reconstructionists generally select some value for the tire/roadway friction. It’s not uncommon to see people cite the friction table from J. Stannard Baker’s 1975 “Traffic Accident Investigation Manual” published by Northwestern University Traffic Institute (now known as the NUCPS, which was essentially reproduced in the 1990 edition authored by Lynn Fricke. The table is almost ubiquitous in reconstruction circles, having been reproduced seemingly by every training facility in the country as well as having been posted online at numerous sites such as VCE, and TAAR. The table-listed values for asphalt are separated for speeds above and below 30mph as shown in the table below.
| DRY ASPHALT |
< 30 MPH |
> 30 MPH |
| NEW, SHARP |
0.80 - 1.2 |
0.65 - 1.0 |
| TRAVELED |
0.60 - 0.80 |
0.55 - 0.70 |
| TRAFFIC POLISHED |
0.55 - 0.75 |
0.45 - 0.65 |
One might expect that a table so commonly used and relied upon was created by conducting exhaustive tests on various surfaces with careful record-keeping and documentation. One would be wrong. During a discussion in the late 1970’s with Joe Badger, J. Stannard Baker said that for most of the values he could not recall who did the testing or how or where they did it, and that he didn't have the test data. [1] If the author can’t provide any substantiation for the result, should we consider it gospel? I would say, “Probably not.” That said, it's important to note that the values listed for many of the situations have been shown over the years to be quite reasonable. Lock et al [2] concluded that using the NUTI table was better than using a drag sled to assess skidding friction on pavement, BUT that's not saying much based on the results shown in SAE paper 2006-01-1398. Jernigan [3] concluded that the numbers given for tires on pavement and concrete are not in agreement with more recent published data. My own tests and observations seem to bear this conclusion out.
This article will list some of the more recent skid-testing data in the literature. A review of this data shows overwhelmingly that the skid-values in the Baker chart are too low for modern cars equipped with modern tires skidding on modern roadways. Furthermore, there is no clear basis for drawing a line at the 30mph mark, as Baker and Fricke have done, with regard to friction values.
Throughout this article, where a value is followed by a plus-minus sign (±) and another value, the first value is the average result of a series of tests, while the second (smaller) value is the standard deviation of the test results assuming a normal distribution. A discussion of the statistical meaning of the normal distribution and standard deviation is beyond the scope of this article, but can be found in any statistics reference book. Citations are listed adjacent to the text discussing their results, and are shown in slightly smaller brown text to more easily distinguish them from the text itself. Underlined passages indicate a hypertext link to another website relevant to the matter at hand, which will open in a separate page when clicked.
NOTE: Anti-Lock Braking Systems (ABS) are now commonly found on many passenger cars. Cars have generally been shown to stop in shorter distances on dry pavement under maximum ABS-braking than during locked-wheel sliding (a higher "drag factor" or effective frictional value). This issue will not be addressed in this article at this time. This article is concerned ONLY with locked wheel skidding on dry pavement.
----------------------------------
[1] Badger, Joseph. Personal communication. February 10, 2007
[2] Lock, J.R., D.L.Ivey, A.S.Jones, K.E.Barnes, O.J.Pendelton, T.Chira-Chavala. Pavement Condition Measurement for Safety Improvements, Vol. 1. Report FHWA/RD-86/003. R&D Contract DTFH61-82-C-00056. U.S. Department of Transportation, Federal Highway Administration. June 1985.
[3] Jernigan, Jack D., Metem F. Kodaman. An Investigation of the Utility and Accuracy of the Table of Speed and Stopping Distances Specified in the Code of Virginia. Virginia Transportation Research Council, Charlottesville VA. Report VTRC 01-R13. May 2001. Accessed 02/10/07 online at http://www.virginiadot.org/vtrc/main/online_reports/pdf/01-r13.pdf.
|
THE RESEARCH
Bellion reported average skid-values of 0.72g to 0.78g.
[Bellion, Peter. Project Y.A.M. (Yaw Analysis Methodology) vehicle testing and findings. SAE Paper 970955. 1997.]
Brown reported dry locked-wheel skid values to be 0.76g from speeds of 35kph and 50kph on finely textured asphaltic concrete.
[Brown, E.C., P.D.Cenek. Tyre Road Friction Coefficients for Crash Recon: Overview of New Zealand Experience. ASPACI "Fact or Friction" Conference. Adalaide Australia. March 2002.]
Dry skid tests conducted by NJDOT personnel in support of an accident reconstruction on a polished section of highway found values of 0.78 to 0.80 using their skid-trailer.
[National Transportation Safety Board. Passenger Vehicle Median Crossover and Head-On Collision With Another Passenger Vehicle, Linden, New Jersey, May 1, 2003. Highway Accident Report NTSB/HAR-06/02. Washington, DC. Adopted February 7, 2006. Accessed 02/10/07 online at http://www.ntsb.gov/publictn/2006/HAR0602.pdf.]
Ebert reported on a series of skid tests undertaken using a standard tire with a specific test protocol to compare the frictional values of actual roads and highways to the frictional values measured at various test tracks. Results for dry sliding tests on actual roads and highways are shown in the table to the right. These tests were conducted almost 20 years ago, and were NOT full-skid-to-stop tests. The values they found are instructive, IMHO, but it should be noted that they encompass some of the lowest values reported by any of the references listed here.
[Ebert, Nancy E.
SAE tire braking traction survey~A comparison of public highways and test surfaces. SAE. Paper 890638. 1988.] |
| Load (lb) | Speed (mph) | n | Avg (g) | Std.Dev. | |
|---|
| 700 | 20 | 20 | 0.72 | 0.056 | |
| 700 | 40 | 11 | 0.72 | 0.058 | |
| 700 | 50 | 18 | 0.75 | 0.063 | |
| 700 | 20-60 | 51 | 0.73 | 0.060 | |
| 1400 | 20 | 20 | 0.63 | 0.059 | |
| 1400 | 40 | 11 | 0.63 | 0.066 | |
| 1400 | 55 | 18 | 0.66 | 0.059 | |
| 1400 | 20-60 | 51 | 0.64 | 0.060 |
|
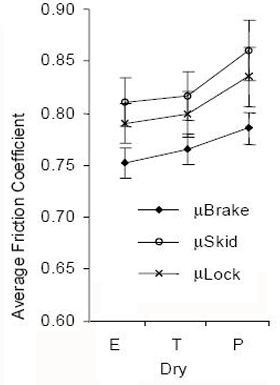
Goudie et al. used three different “grades” of commonly available passenger car tires and conducted hundreds of skid tests. The average for all their tests on dry pavement were 0.828g ± 0.033, as shown below, with all values well above 0.70g. [Goudie, D.W., J.J.Bowler, C.A.Brown, B.E.Heinrichs. Tire Friction During Locked Wheel Braking. SAE Paper 2000-01-1314. 2000.]
|
|
FIGURE AT LEFT: Average friction values on dry pavement based on brake onset, skid onset, and first wheel-lockup, as a function of tire type (economy, touring, or performance). From Goudie et al., SAE 2000-01-1314 |
| |
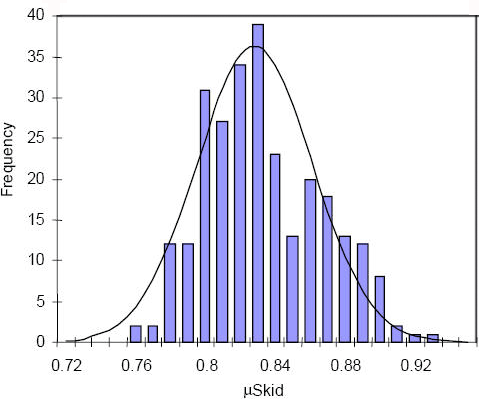 |
FIGURE AT RIGHT: Distribution of mu-skid values for all three tire sets under dry road conditions with superimposed normal distribution (0.828g ± 0.033g). From Goudie et al., SAE 2000-01-1314
|
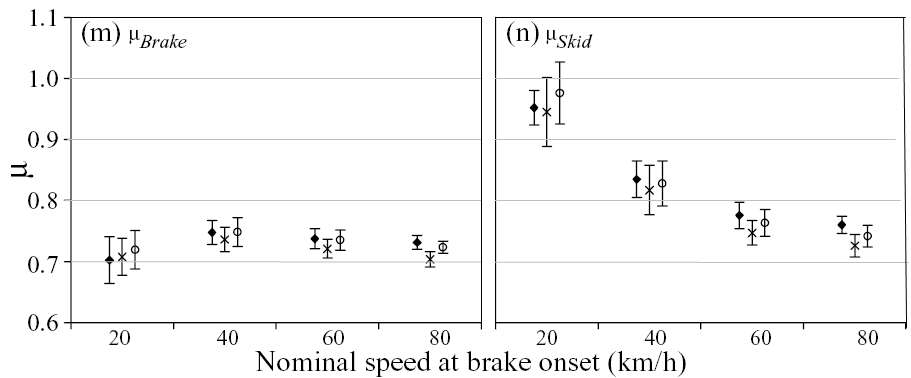
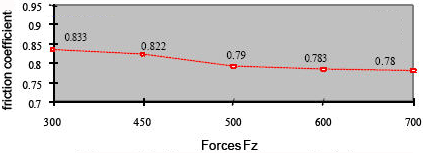
252 tests from the same dataset were used by Heinrichs et al. to investigate the effects of speed on measured drag factor. The results are shown in the figure below. We immediately see that even under tightly controlled test conditions, the skidding friction value can vary quite a bit from the value based on total braking distance.
[Heinrichs BE, Allin BD, Bowler JJ, Siegmund GP. Vehicle speed affects both the pre-skid braking kinematics and the average tire/roadway friction. Accident Analysis and Prevention, online doi: 10.1016/j.aap.2003.08.002.2003.]
 |
|
Reed and Keskin skid-tested several vehicles. The average drag factors were generally in excess of 0.7g, as shown in the figure to the right, while no value was below 0.65g.
[Reed, W.S., A.T.Keskin. A comparison of emergency braking characteristics of passenger cars. SAE Paper 880231. 1988.]
|
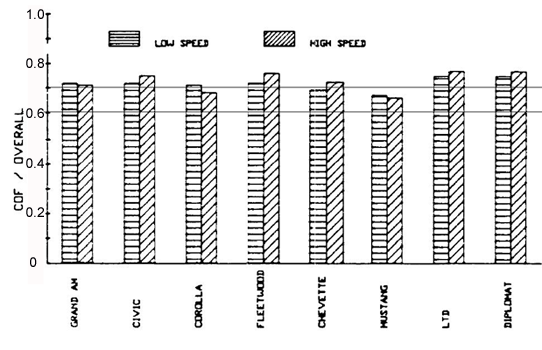 |
| Skid values for eight vehicles at high and low speeds. From Reed, SAE 880231 |
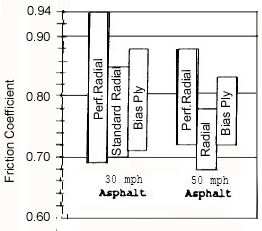 |
Wallingford et al. skid-tested several vehicles at 30mph and 50mph with three different types of tire: "Performance Radial", "Standard Production Radial", and "Bias Ply." For tests conducted on pavement with tires in good condition (i.e. did not have cord showing), the drag factor was measured to be 0.77g ± 0.08 for tests conducted from 30mph and 0.76g ± 0.08 at 50mph. The actual test data are shown in the figure to the left.
[Wallingford, J.G., W.Greenlees, S.Christoffersen. Tire-roadway friction coefficients on concrete and asphalt surfaces applicable for accident reconstruction. SAE Paper 900103. 1990.]
|
Overgaard reported the results of 50 skid tests conducted with 3 different vehicles. The results were not tabulated in the paper, but the data was provided for each test. Tabulating the data from the results for each vehicle yields the results shown in the table to the right. [Overgaard, R., R.Johal, M.Araszewski, A.Toor. Relationships between pre-skidding and pre-braking speed. SAE Paper 2001-01-1281. 2001.]
|
|
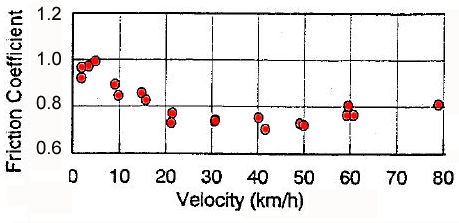 |
Yamazaki reported a number of tests at various speeds, as shown in the figure to the left. The drag factors for all tests were above 0.70g, and clearly did not show the monotonically decreasing trend assumed by some authors working with less complete data sets. The average drag factor was approximately 0.80g.
[Yamazaki , Shunichi. Friction Coefficient of Tires and Skid Marks Left by Tire. International Workshop on Traffic Accident Reconstruction. National Research Institute of Police Science. Kashiwa, Chiba, Japan. November 1998.] |
Eubanks et al. [1993] conducted several skid tests with each of several vehicles, and measured the chassis acceleration with several different tools. The figure below shows the results of the non-ABS vehicles in their testing, with one standard deviation bars around the average value indicated. The lowest value for the entire test series was approximately 0.65g, with an overall average skidding value in excess of 0.80g.
[Eubanks, Jerry J., W. R. Rusty Haight, Russell N. Malmsbury, David A. Casteel. A comparison of devices used to measure vehicle braking deceleration. SAE Paper 930665. 1993]
|
 |
| Multiple skid tests for 6 vehicles. From Eubanks, SAE 930665 |
 |
Delanne et al. showed that skid testing at different normal loads had a minor affect on the results, but in all cases, the average skid value was greater than 0.75g. The chart of locked and peak frictional values he reported is shown in the figure to the left.
[DeLanne, Y., G.Schaefer, D.Lechner, V.Schmitt, G.Beurier. Vehicle Dynamics and tyre road friction performance models. 2nd International Colloquium on Vehicle Tyre Road Interaction. Florence Italy. February 2001.] |
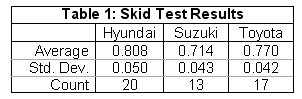
In an SAE paper, along with several others reported the results of a number of skid tests conducted by several operators using several vehicles at 7 different sites. During one of the events described in the paper, one vehicle was tested at three different sites. The sites were specifically chosen because they appeared to be very different from each other in paving condition. The average skid-test results measured with a VC3000 were 0.741g, 0.717g, and 0.777g. At a different event, multiple vehicles were skid-tested at two sites. The results from those tests are shown in the table to the right.
[Bartlett, Wade, Albert Baxter, Ed Livesay, Bruno Schmidt, Terry Stanard, William Wright. Comparison of Drag-Sled and Skidding-Vehicle Drag Factors on Dry Roadways. Society of Automotive Engineers. Paper 2006-01-1398. 2006. ]
|
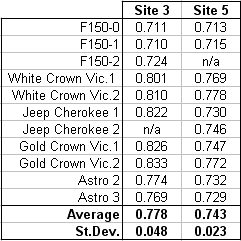
|
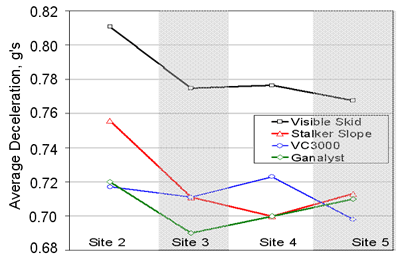 |
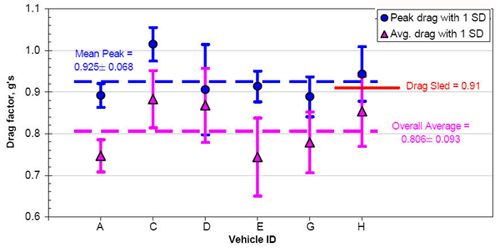
The F-150 noted in the above table consistently produced the lowest skid values. The results for that vehicle, as measured four different ways at four different sites during that same event is shown at right. At all locations, regardless of how the measurement was done, the skid values were in excess of 0.69g.
|
|
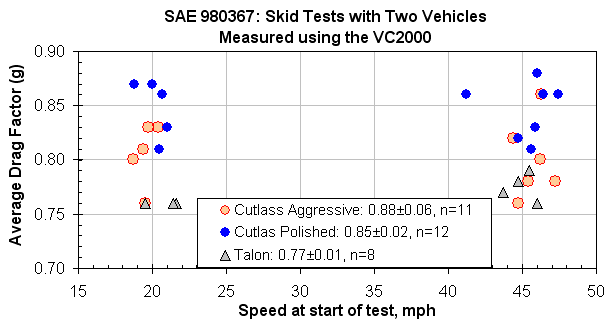
Brach et al. reported on skid tests conducted with two vehicles. Test surfaces included one particularly aggressive pavement and one surface characterized as “polished.” The results were reported based on several possible ways of calculating the average drag factor. The most reliable technique appeared to be the VC2000, which is shown below. Using the total stopping distance and a RADAR-measured entry speed, the average values fell by 0.04g to 0.09g from the values shown below. As with the Overgaard paper cited earlier, data for each test were provided. I have plotted those results as a function of speed in the figure below. For their many tests, no single value was below 0.70 even based on the total stopping distance, with overall average values based on the two techniques being 0.76g (Radar/Distance) and 0.81g (VC).
[Brach, R.M., Donald F. Rudny, David W. Sallmann. Comparison of tire friction test methodologies used in accident reconstruction. Society of Automotive Engineers. Paper 980367. 1998.] |
 |
|
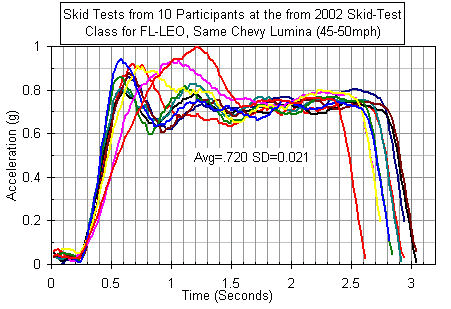
In 2002, a day-long "Conducting and Evaluating Skid Tests" training event was conducted in Palm Beach County, Florida for members of various Florida law enforcement agencies. After practice and coaching, 10 participants conducted a skid test in a Chevrolet Lumina instrumented with CG-mounted accelerometers. The most interesting aspect, to me, was how the person with the slowest rise-time got the highest peak value, as a result of getting more work out of the rears before locking the fronts as compared to everyone else. This data has thus far been unpublished. The class was conducted by then-Deputy William Wright (who is now retired from LE and running Florida Reconstruction).
|
 |
SUBTOTAL
|
A simplistic analysis of the values shown so far gives an overall average value of 0.77g with a standard deviation of ± 0.04 to 0.05g. This indicates that 95% of all cases can be expected to fall between 0.69g and 0.87g.
|
One accident reconstructionist acquaintance of mine from Baker Materials Engineering shared with me a spreadsheet with more than 4000 friction test results from a variety of sources. What a mountain of work that must have been! Thanks, guys! I whittled down that huge list to capture just the dry pavement, non-ABS, passenger car skidding values.
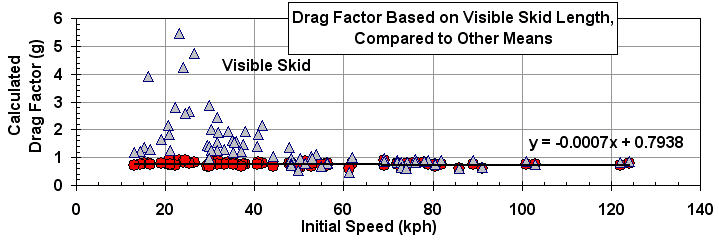
I teased out the tests where the result was calculated based on visible skid length AND based on either a VC/Ganalyst/Skidman/accelerometer. The results below 40kph were really scary, as you can see below. This is consistent with the results noted in Eubanks et al. as well. At higher speeds, the visible-skid values were closer to the accelerometer values, but they were still commonly 10 to 20% higher. I discarded all results based solely on skid-length. Though there is a slight speed-dependency shown (-0.0007g/kph), the data set is small. See below for a more robust dataset.
I discarded all tests with results solely based on shot-markers. In addition to the distance covered during skidding, shot markers incorporate the lag time for the brake system to build pressure, and in so doing always generate longer than actual stopping distances, which results in friciton values which are lower than actual. I also tossed all tests noted to have used only front or rear brakes.
For tests where results were calculated by two accelerometer-based systems, I compared those numbers and tossed all cases where two devices disagreed by more than 0.02g. I averaged the results where they were within 0.02g of each other.
There was one 0.94g test noted to be "ABS disabled", but it looks a lot like the ABS tests for that car...I am suspicious, so I threw it out.
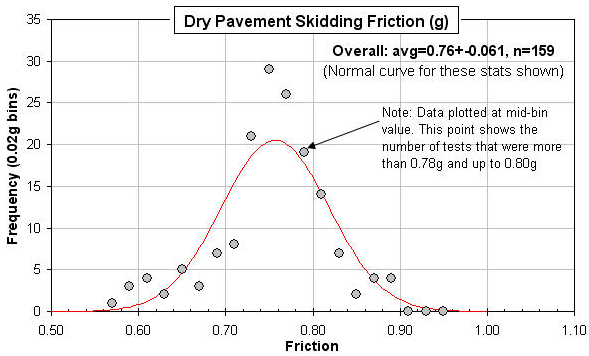
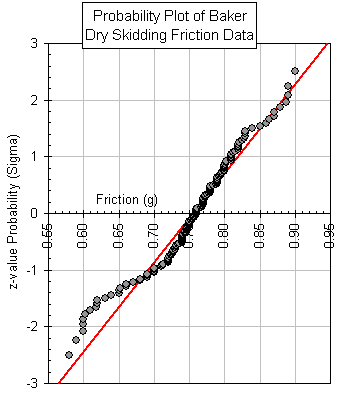
One hundred fifty nine tests remained. They had an average of 0.76 ± 0.061g. as shown below.
The normal curve doesn't quite fit the data: the data is a little "peakier" (kurtosis= +0.76) and it's a little weighted to the low end (skewness= -0.49). But as a statistical tool, average and standard deviation still look like pretty good descriptors.
The probability plot for this data set is shown to the right. A normally-distributed dataset would form a straight line. Though most of the mid-range values do form a line (at a steeper slope, or tighter distribution than the overall value indicated), the end values, particularly the low-end values are not that close to the line. These points which deviate from the line may be a result of mechanical deficiencies in the vehicle under test, errors in the conduct of the test, measurement errors, even transcription errors.
|
|
|
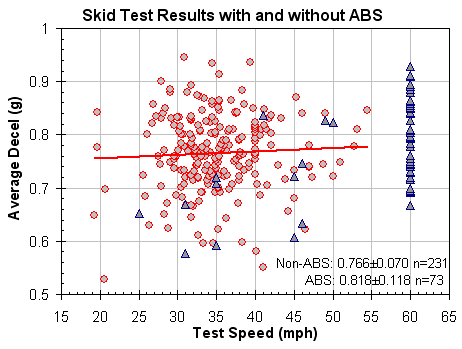 Another investigator assembled skid-test data from a large group of published and unpublished sources. The source list has very little overlap with the Baker Materials Engineering data set noted above, having been largely drawn from private test results. After a similar vetting process as that noted above, there were 231 non-ABS tests and 73 ABS-stops conducted on dry pavement or chipseal. The figure to the right shows that there was only a weak speed-relationship for the non-ABS tests, and that the trend was for drag values to be HIGHER at higher speed.
 This may be a reflection of the availability of better measuring equipment since that table's creation.The red line shown is the least-squares linear fit trendline for the non-ABS data. The number of lower speed ABS-tests is relatively small, so no trendline is shown. Breaking out the dry non-ABS tests measured with an accelerometer-based device (VC200, G-analyst, etc) from those where no test technique is provided produced interesting results. Fifty-One tests were measured with electronic means, with a result of 0.763±0.046. The 180 tests for which the measuring technique are not shown gave a result of 0.767±0.076g. The tests known to have been measured using an accelerometer-based device produced significantly tighter results.
 |
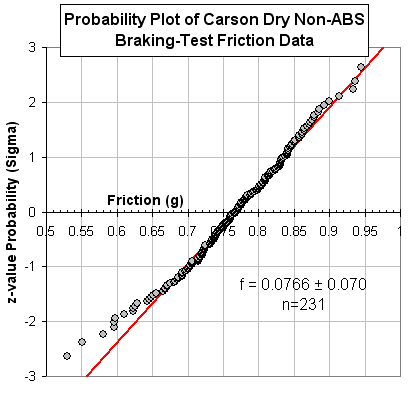
The probability plot of the complete non-ABS data set is shown to the left. Though it follows the anticipated line more closely than the Baker data above, the low-fricion values clearly shows an unexpected divergence. |
|
CONCLUSION
 The data above show that there is little or no support in the recent literature for the low-end skidding values cited in the NUTI manuals for clean dry pavement. I continue to maintain that the ranges for skidding vehicles listed in the NUTI table are too conservative (unless, perhaps, you're analyzing a 1960's or older car with vintage-made rubber). I also maintain that if you're going too low for one person, you're probably going too high for someone else. The data above show that there is little or no support in the recent literature for the low-end skidding values cited in the NUTI manuals for clean dry pavement. I continue to maintain that the ranges for skidding vehicles listed in the NUTI table are too conservative (unless, perhaps, you're analyzing a 1960's or older car with vintage-made rubber). I also maintain that if you're going too low for one person, you're probably going too high for someone else.
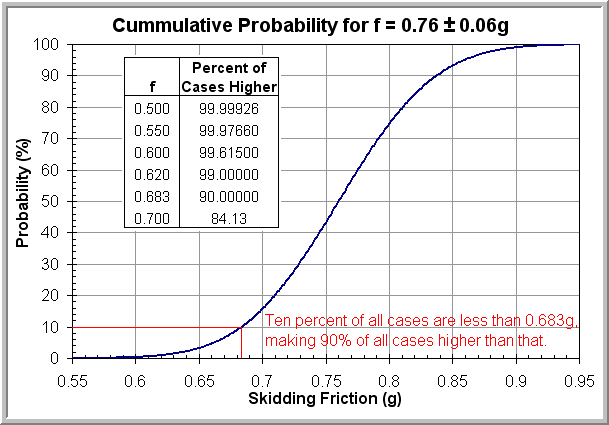
Evaluating the reported friction values from multiple different sources using a variety of vehicles, drivers, surfaces, measuring tools, and analysis techniques gives average values in the 0.76g range with standard deviations of 0.04 to 0.07g. Given an average of 0.76+-0.06g, 95% of all cases can be expected to fall between 0.64g and 0.88g. The figure to the right shows the cummulative probability distribution for these stats.
Barring really unusual stuff which should be obvious to someone on scene (melting tar, blowing sand, etc), using a 0.6g value for dry clean pavement is quite conservative, and represents something less than 4 in 1,000 cases, or put another way, is lower than more than 99.61% of all cases. Even a value of 0.7g is lower than more than 84.1% of all cases, and could easily be termed "conservative" for many applications.
The NUTI low value of 0.55g for "travelled" pavement, though not impossible given the normally distributed nature of real-world events, is unlikely, occurring about once in 4,273 cases.
|
Mechanical Forensics Engineering Services, LLC.
This page created 12-FEB-2007
and last modified 17-FEB-2007

|
|